Customer analytics · Research
Drop-off rates and support tickets tell you that people are getting stuck. They don't tell you which field is causing the problem.
We analyzed 128 fields across insurance journeys to see which ones take the most time, trigger the most errors, and create the most friction.
Key takeaways
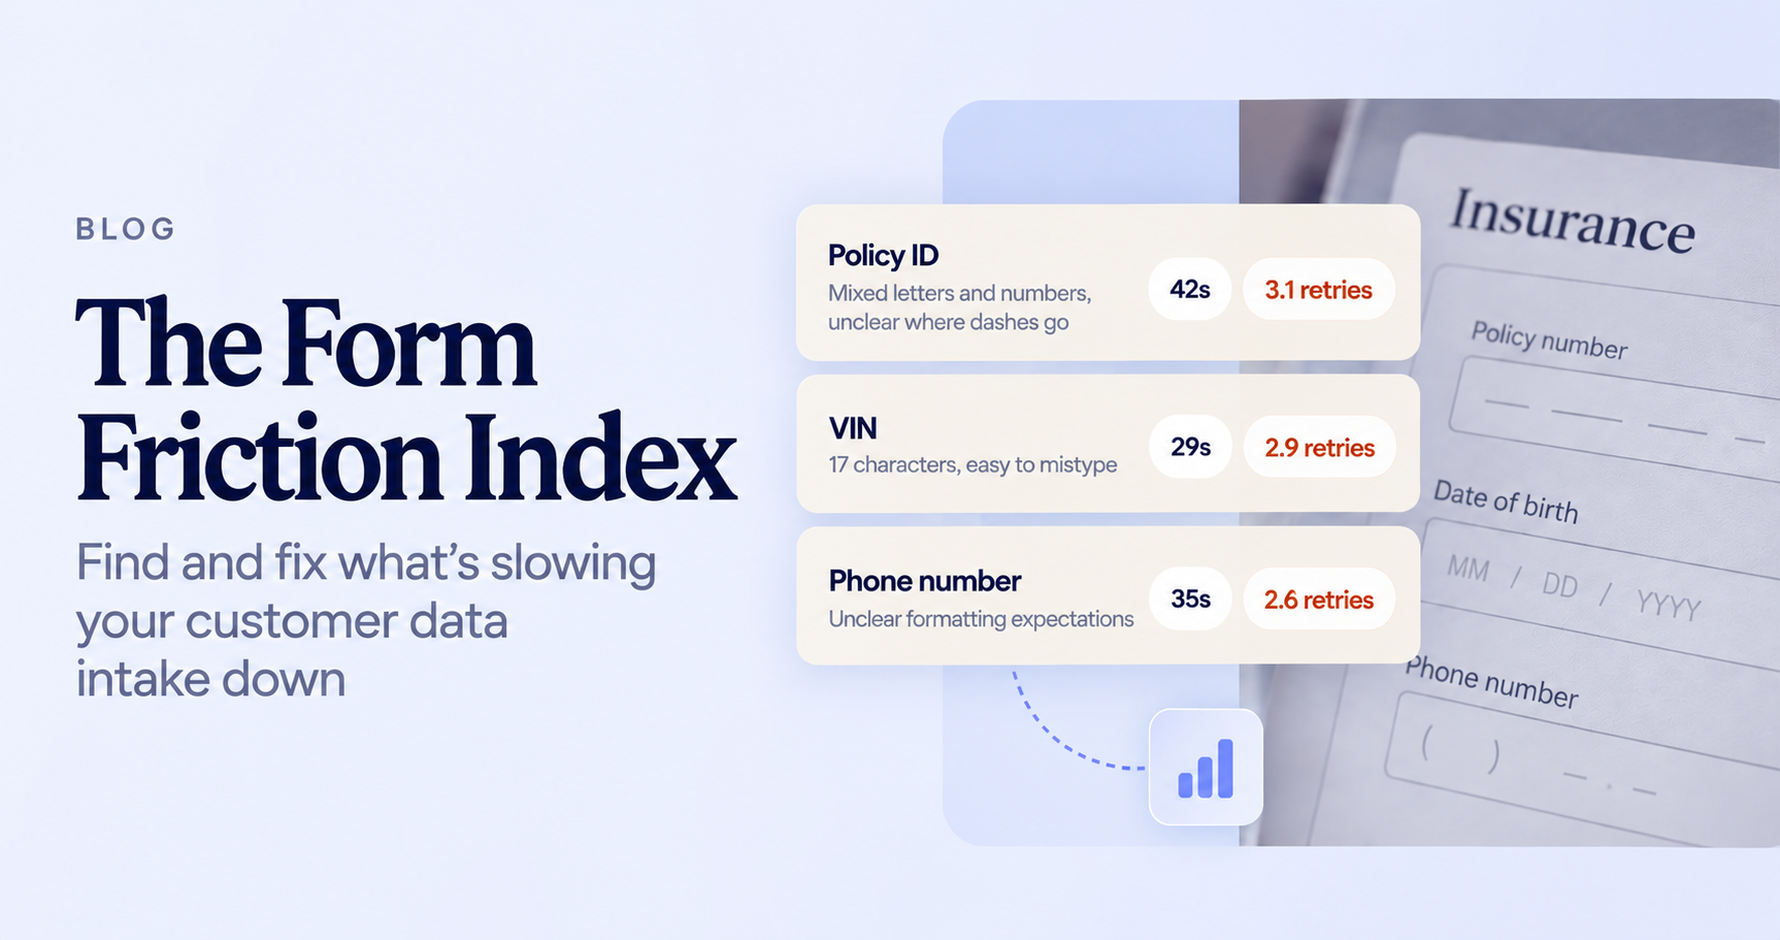
- Policy ID is the highest-friction field we tracked, taking 42 seconds on average and generating 3.1 validation retries.
- Friction comes in two forms. Confusion shows up through errors and retries. Silent frustration shows up in the time people spend on a field.
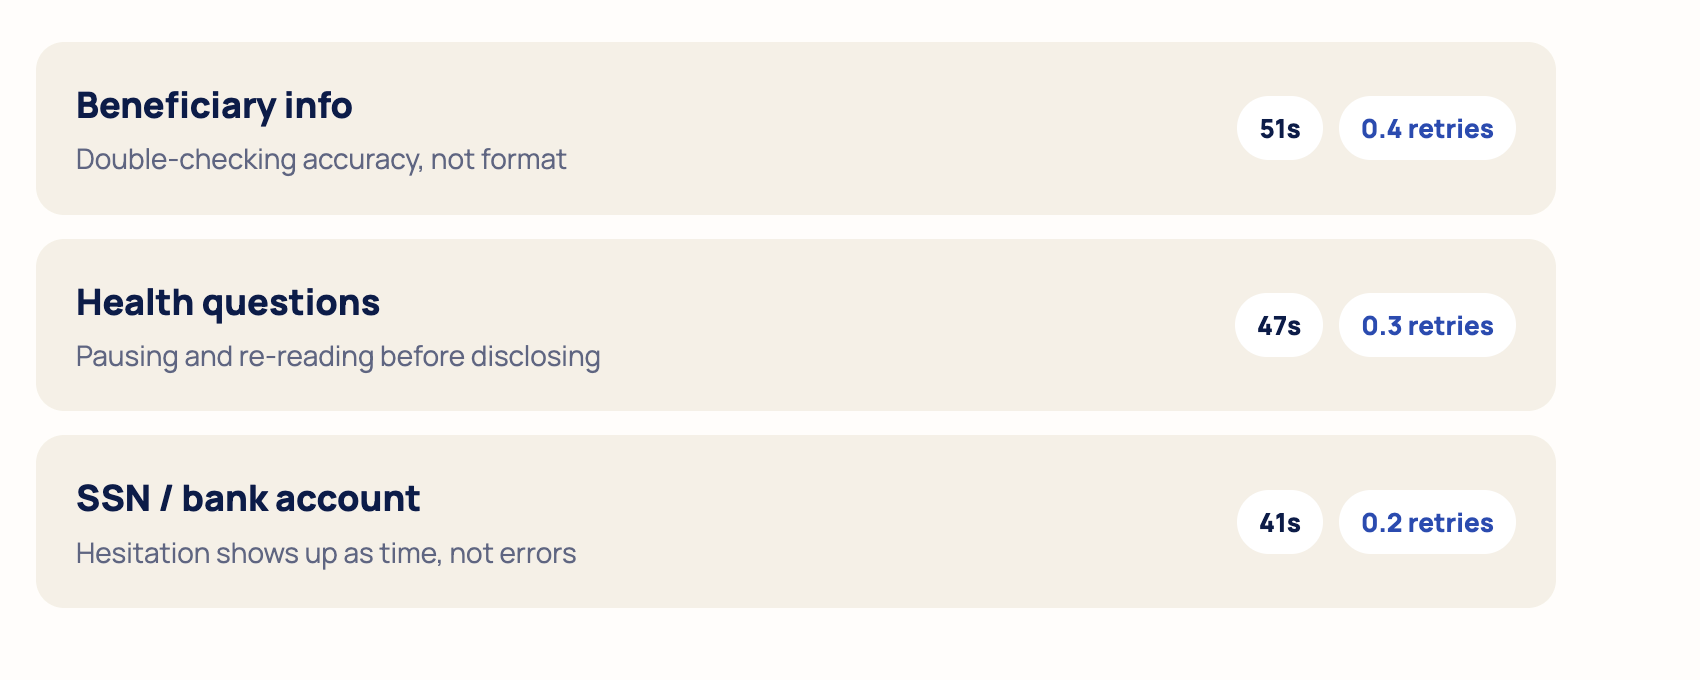
- Beneficiary information, health questions, and SSN / bank fields take 41–51 seconds but rarely trigger an error. An error report alone would miss them.
- The two types of friction need different fixes: make confusing fields easier to complete, and reduce the effort involved in fields that take longer.
Why error rates only tell half the story
Most teams find problem fields by looking at validation errors. If a field keeps rejecting an answer, it gets attention. If people get through it without an error, the field is usually considered fine.
But that's not the whole picture.
People can spend a lot of time on a field without ever entering the wrong answer. They might stop to re-read the question, find a document, check a detail, or think through an answer.
Nothing goes wrong from the form's perspective. But the customer is still spending more time and effort than they should.
That's why we built the Friction Index. It combines two signals for every field into a score from 0 to 100:
- Time on field: how long people spend on a field before moving on.
- Validation retries: how often they have to correct their answer.
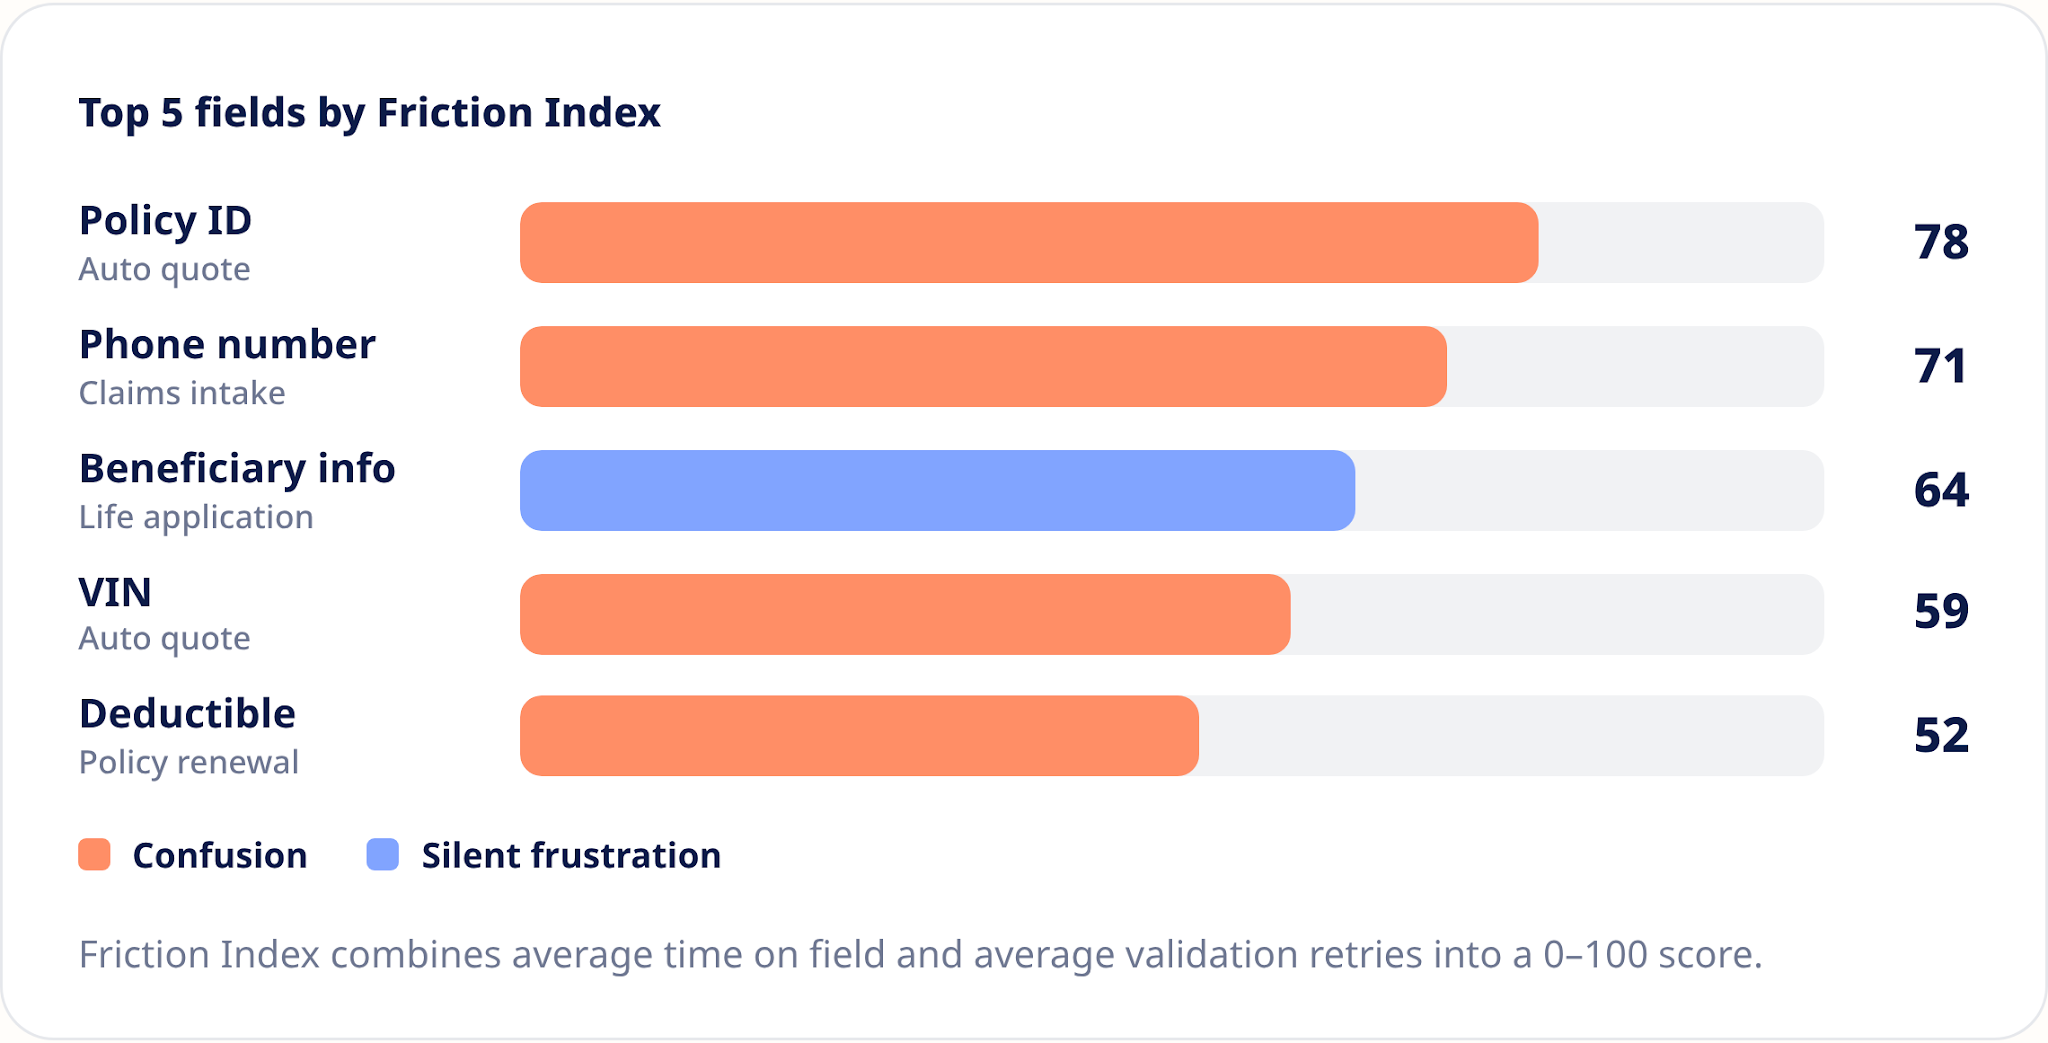
The Friction Index combines average time on field and average validation retries into a 0–100 score.

The highest-friction fields
The top of the list isn't surprising. Long codes and strict formatting requirements tend to create problems.
But there's an interesting exception: Beneficiary information takes longer than almost every other field, even though it generates very few errors.
Top 5 fields by Friction Index
Full ranking
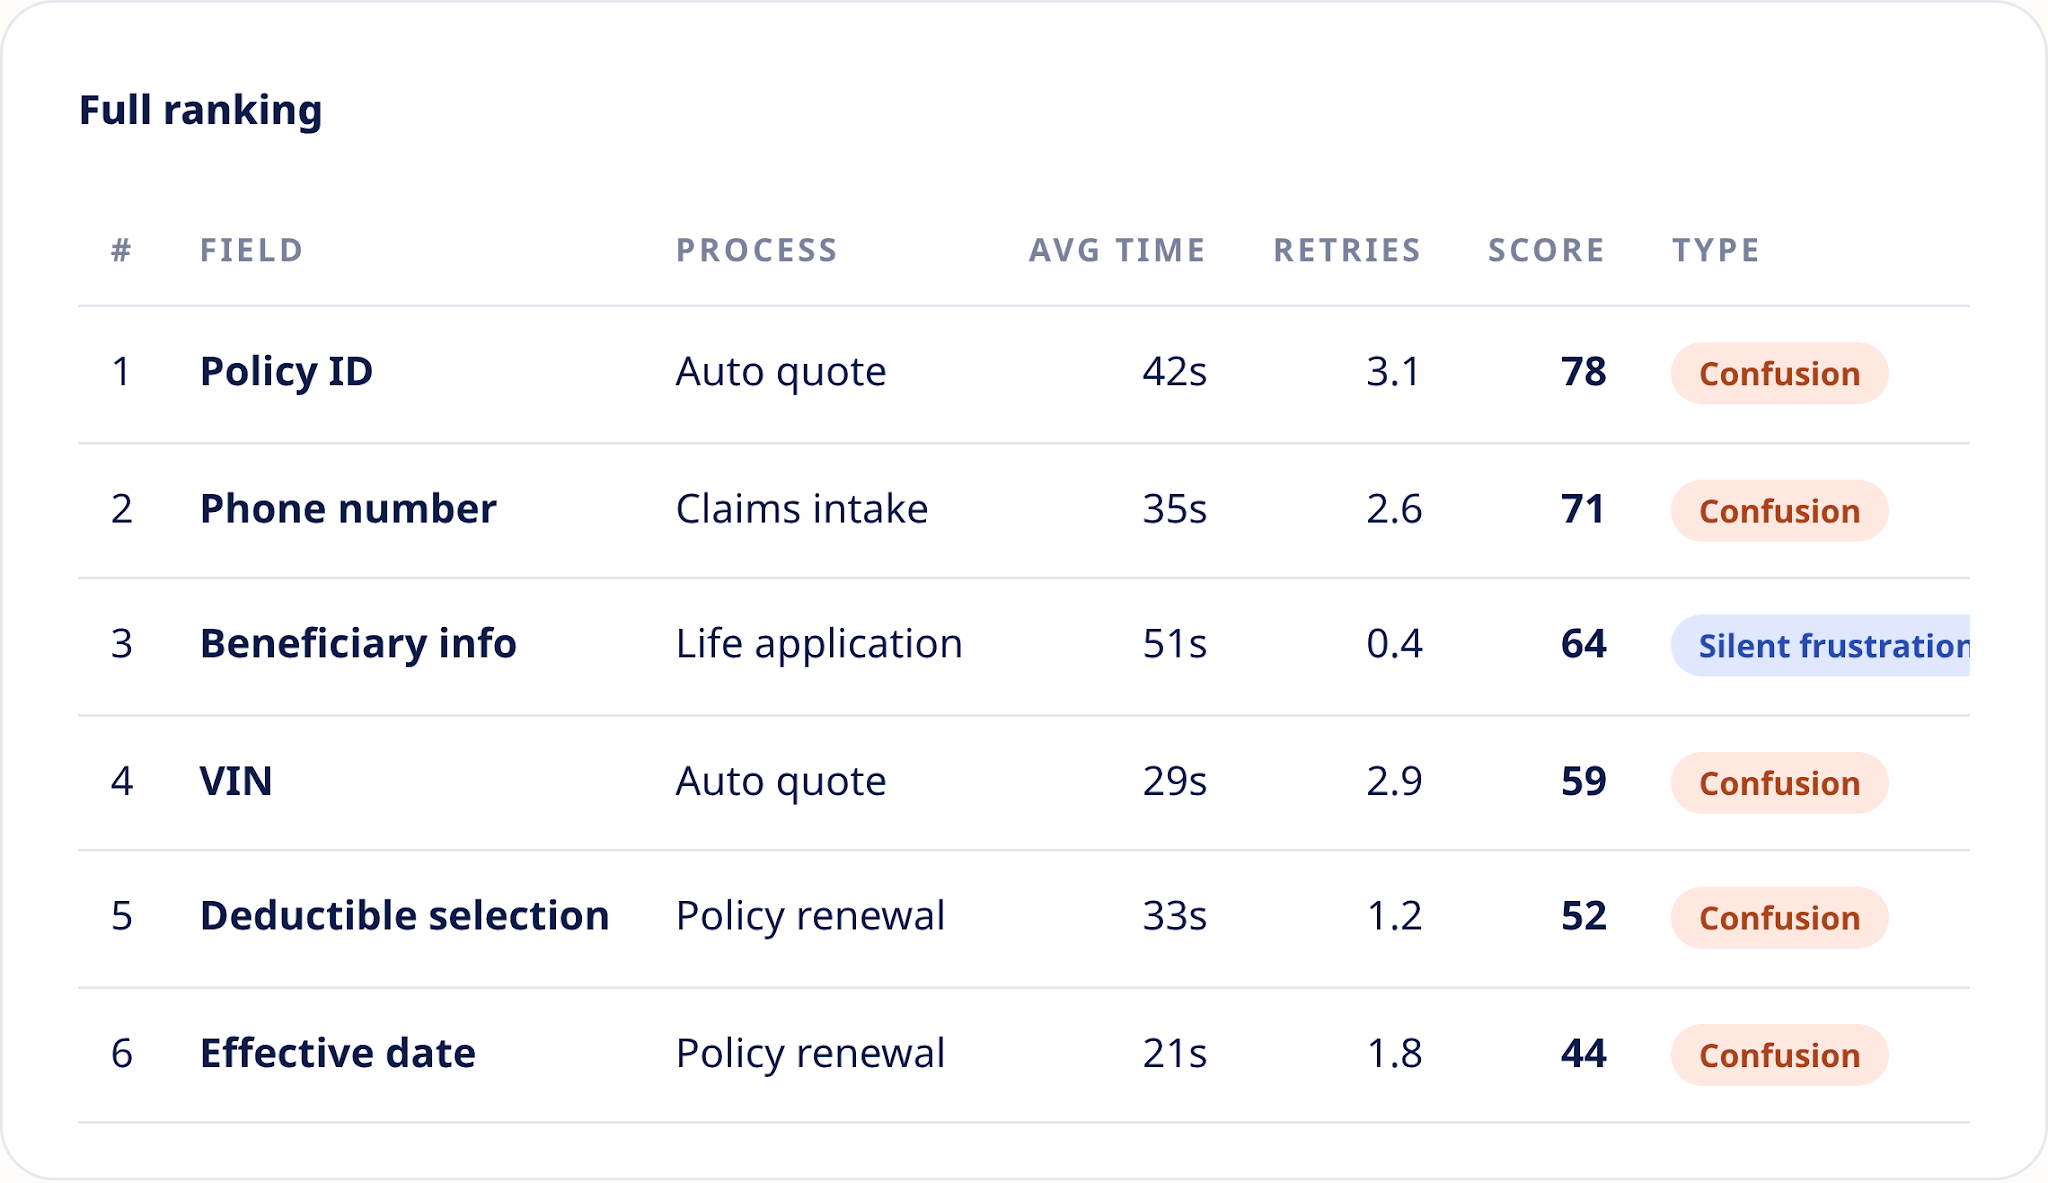
Look at number three. Beneficiary information takes 51 seconds on average, but generates just 0.4 retries.
If you were only looking at error rates, it would look like one of the easier fields.
The time tells a different story.
Two kinds of friction
When you compare time spent on a field with validation retries, four patterns emerge. Two are especially useful for understanding where a journey is creating extra work.
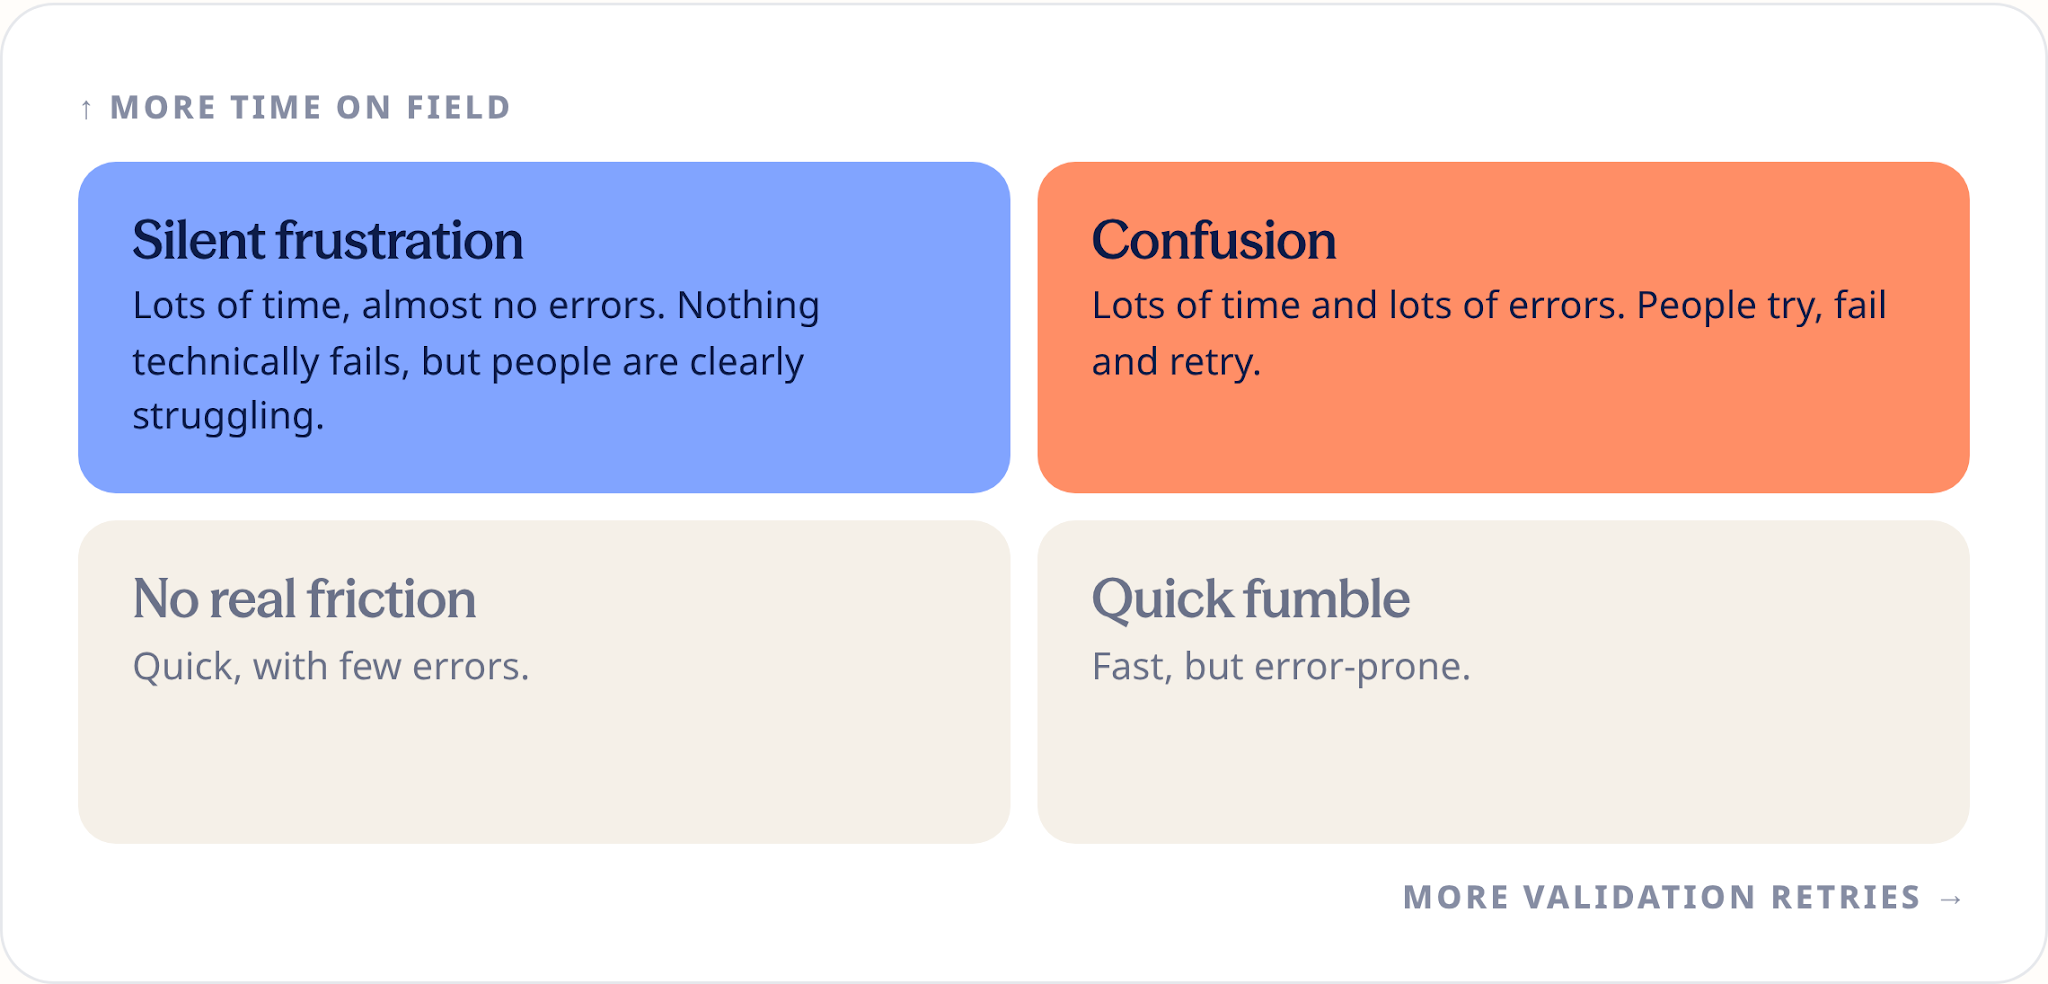
Confusion: “What format do you want from me?”
With these fields, errors and time rise together. People generally know the information they're entering, but they're not sure how the form wants them to enter it.
Silent frustration: “This takes time, even when nothing goes wrong.”
These fields take a long time to complete but rarely generate an error. People may need to look up information, check a document, think through an answer, or review what they've entered.
The important point is that the extra effort shows up in time, not validation retries.
Errors predict time, until they don't
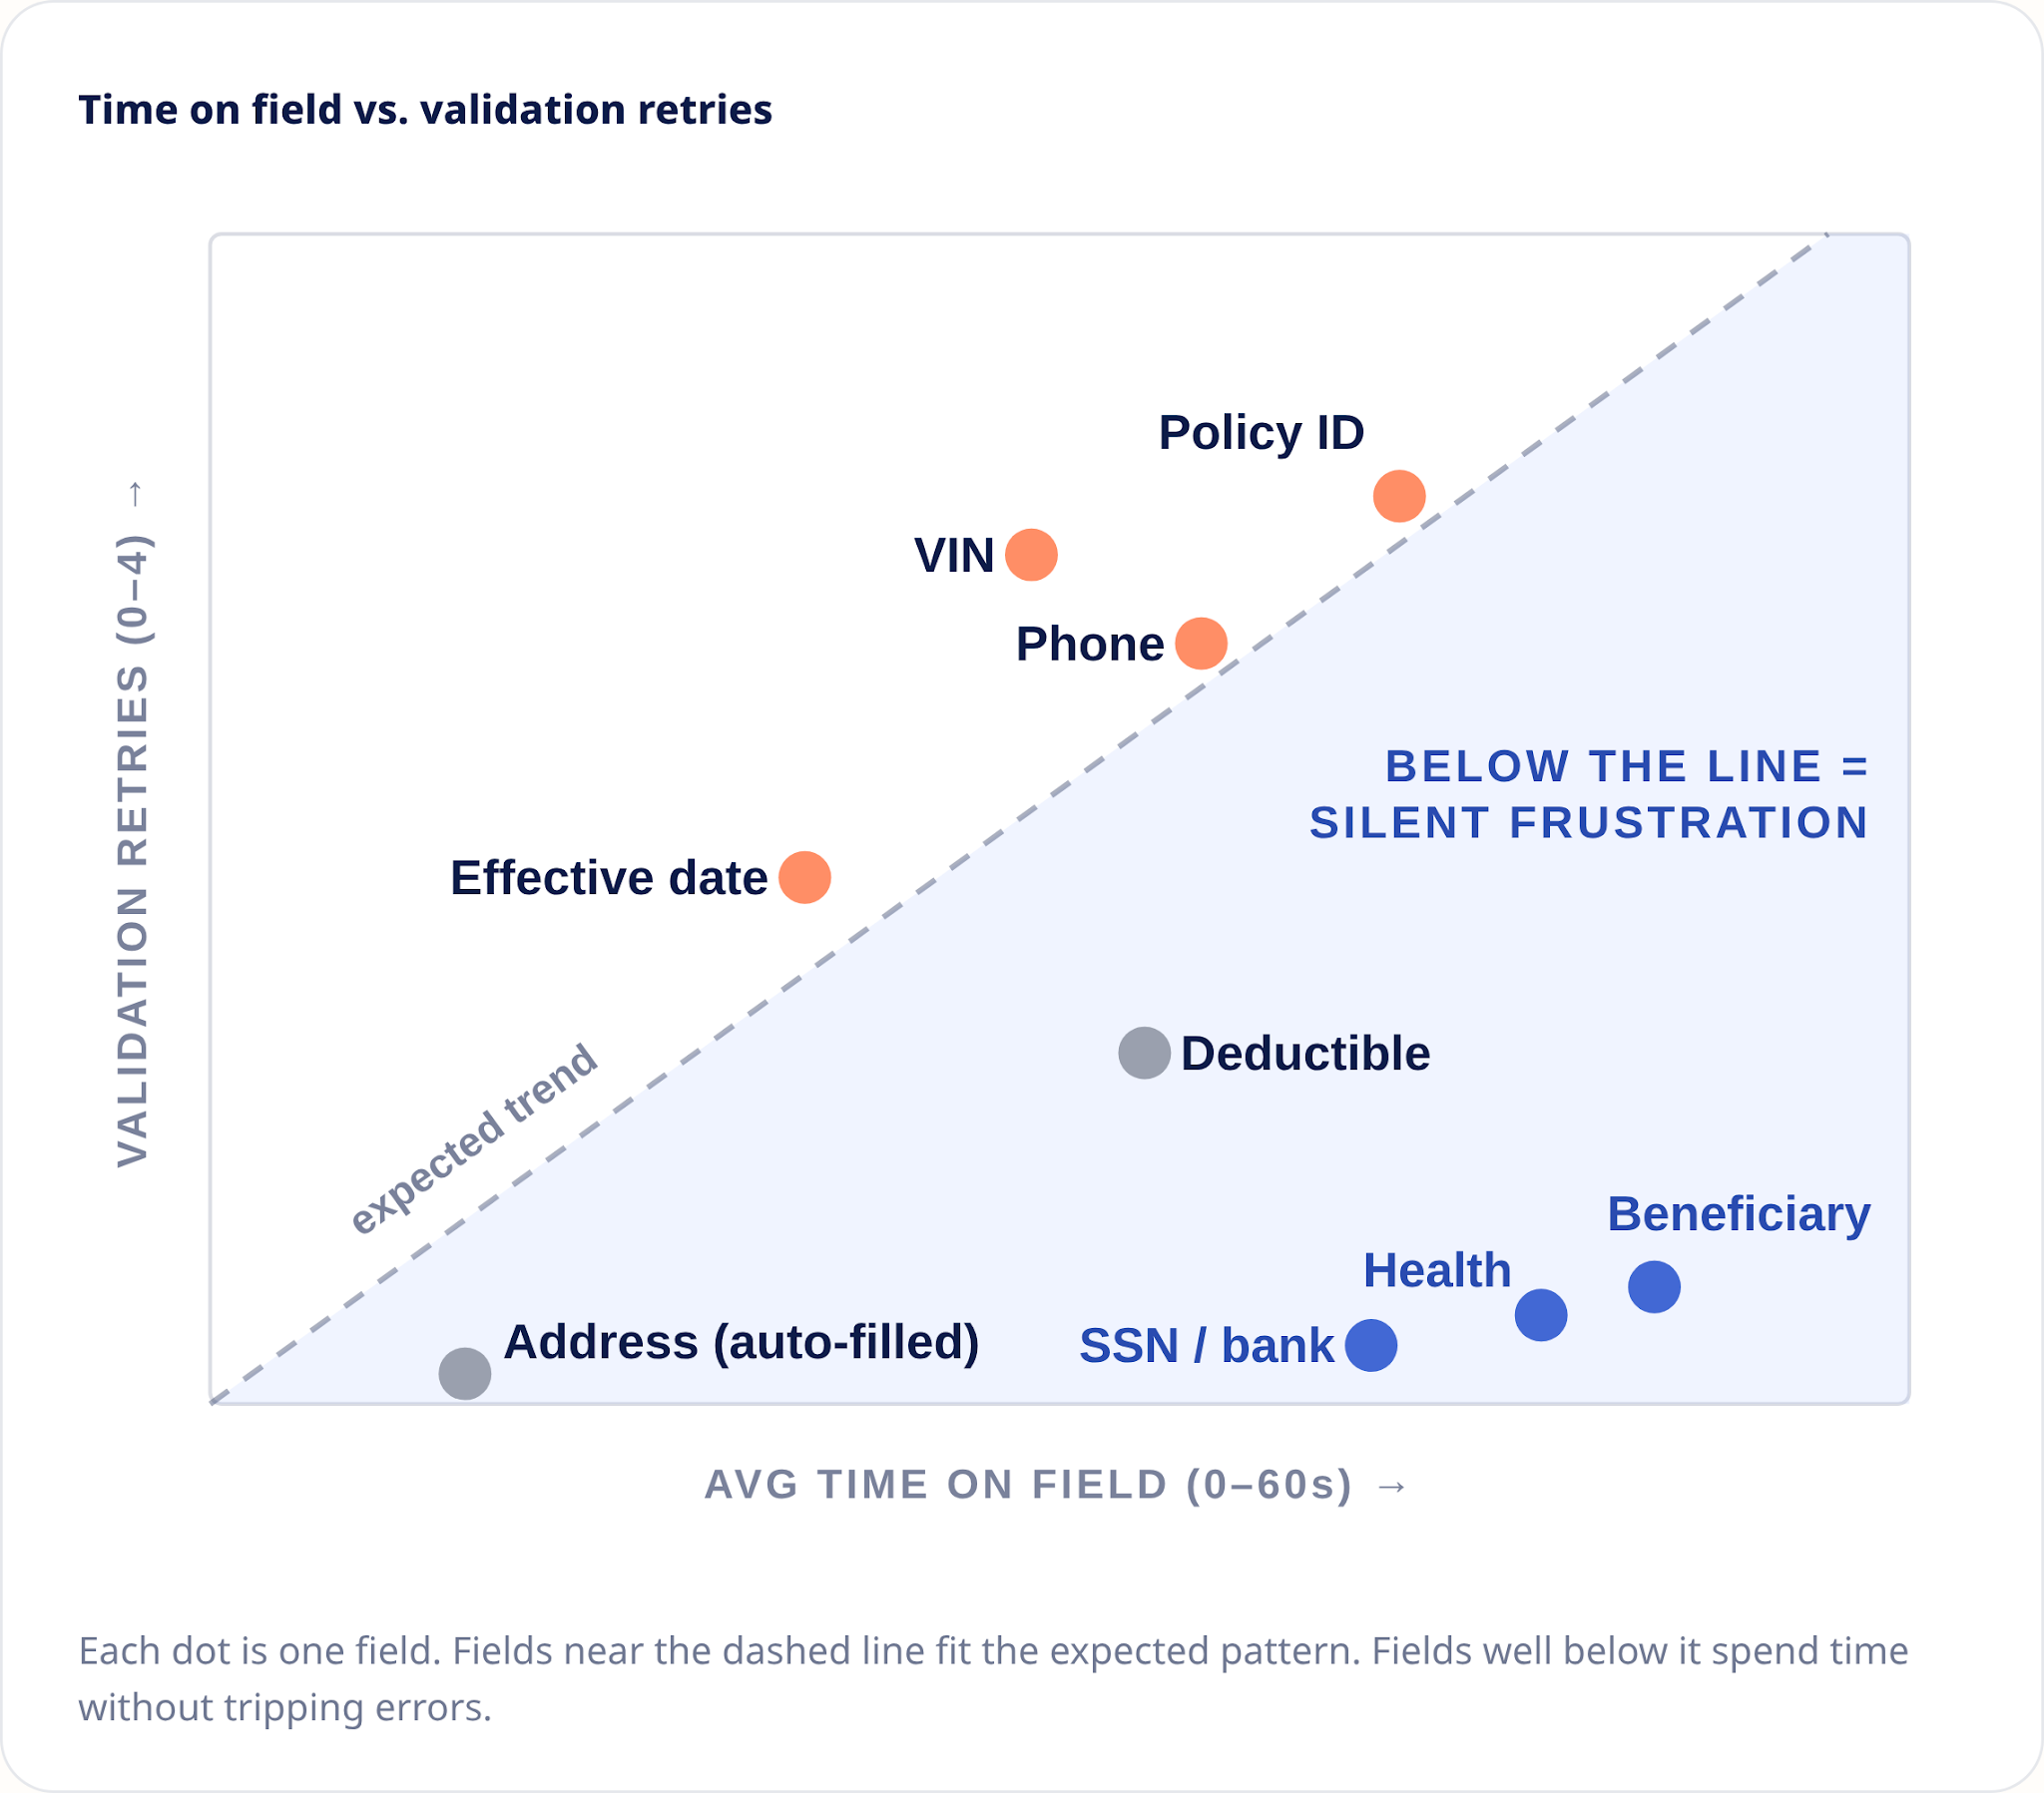
For confusion fields, time and errors move together closely (r ≈ 0.81). More retries generally mean more time.
But 4 of the 9 fields we plotted fall well below that trend. They take far longer than their error count would suggest.
That's where silent frustration shows up: the field takes time, but the form never registers an error.
Different friction, different fix
The two types of friction have different causes, so they need different fixes.
And where you can, remove the field entirely.
In our data, the auto-filled address field took 9 seconds with 0.1 retries — the lowest friction of any field we plotted.
A form can pass every validation and still make the people filling it out work harder than necessary.
Start measuring friction, not just errors
If you only track errors, you'll find the fields people struggle to complete correctly. You won't necessarily find the fields that take a long time for other reasons.
Measuring time alongside retries gives you both sides of the picture. You can see which fields create friction, understand what's happening, and decide what to fix first.
See where your forms create friction
EasySend gives you field-level analytics across digital journeys, so you can see where people spend time, where they run into errors, and which parts of the journey need attention.
FAQ

Forget forms. Create digital customer journeys.